Title here
Summary here
CHIPS’ dashboard1 provides a synoptic and intuitive interface for data exploration, including zoomable distribution maps and dynamic visualizations such as line charts and ternary plots.
Dashboard and datasets
The dashboard is publicly accessible at: https://iramat-apps.cnrs.fr/dash/, while published datasets are listed in the DB documentation section
The dashboard landing page uses a dynamic Leaflet interface with common geoweb functionalities, including zooming, panning, and interactive information displayed on hover.
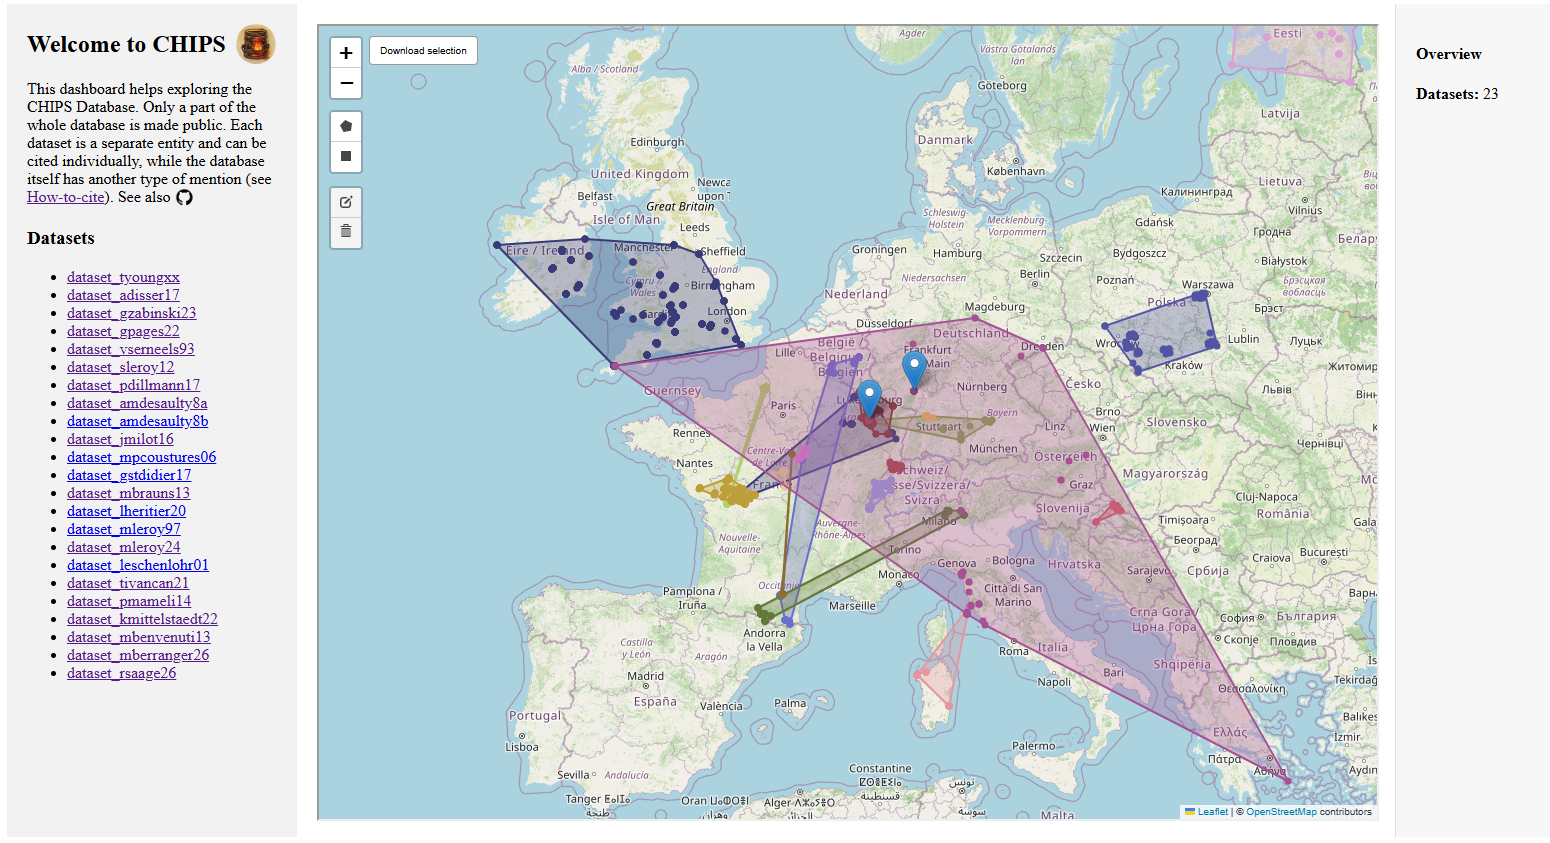
Landing page of the CHIPS dashboard, showing the spatial distribution of CHIPS interoperable (API-based) datasets.
Data from multiple published datasets can be selected simultaneously using the Leaflet selection tools (rectangle, polygon, etc.) on the top-left corner of the map, and exported as a single CSV file.
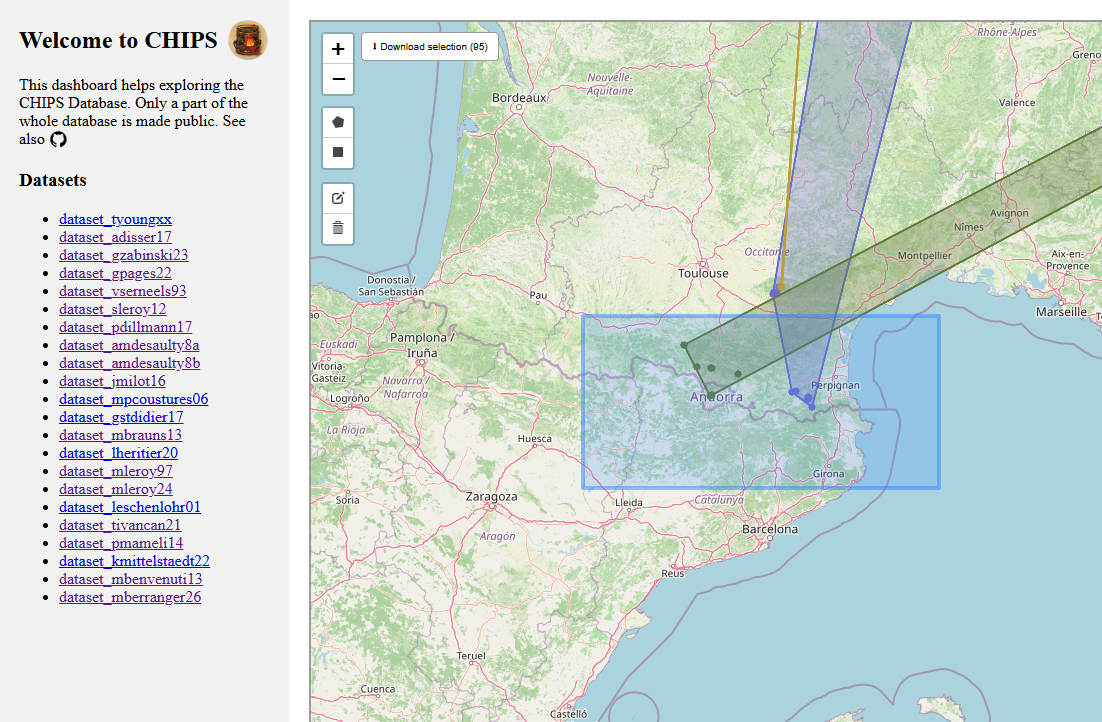
Downloading and exporting data from multiple datasets using the Leaflet tools (top-left corner of the map)
From this page, users can access data from individual datasets. For example, the dataset_gzabinski23 dataset is available at: https://iramat-apps.cnrs.fr/dash/mapview?dataset=dataset_gzabinski23
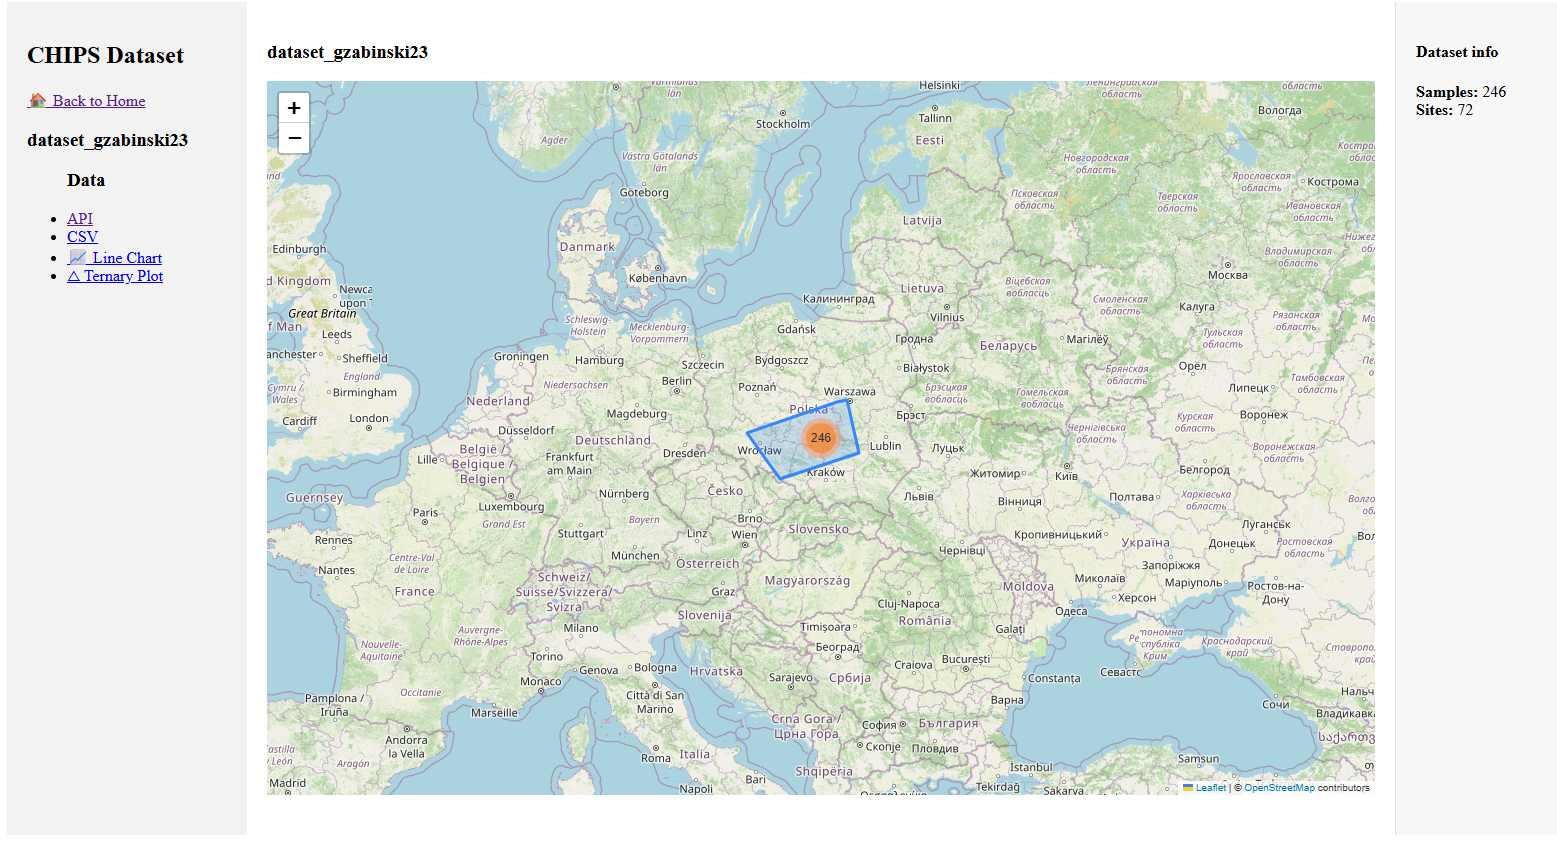
Landing page of the `dataset_gzabinski23` dataset.
From this point, the left sidebar offers direct access to:
Compositional data can be explored through several dynamic Plotly visualizations, featuring zooming, hovering, and interactive pop-up windows.
Among the different plots calculated on the fly from the API, one of these is the line chart: https://iramat-apps.cnrs.fr/dash/dataset_gzabinski23
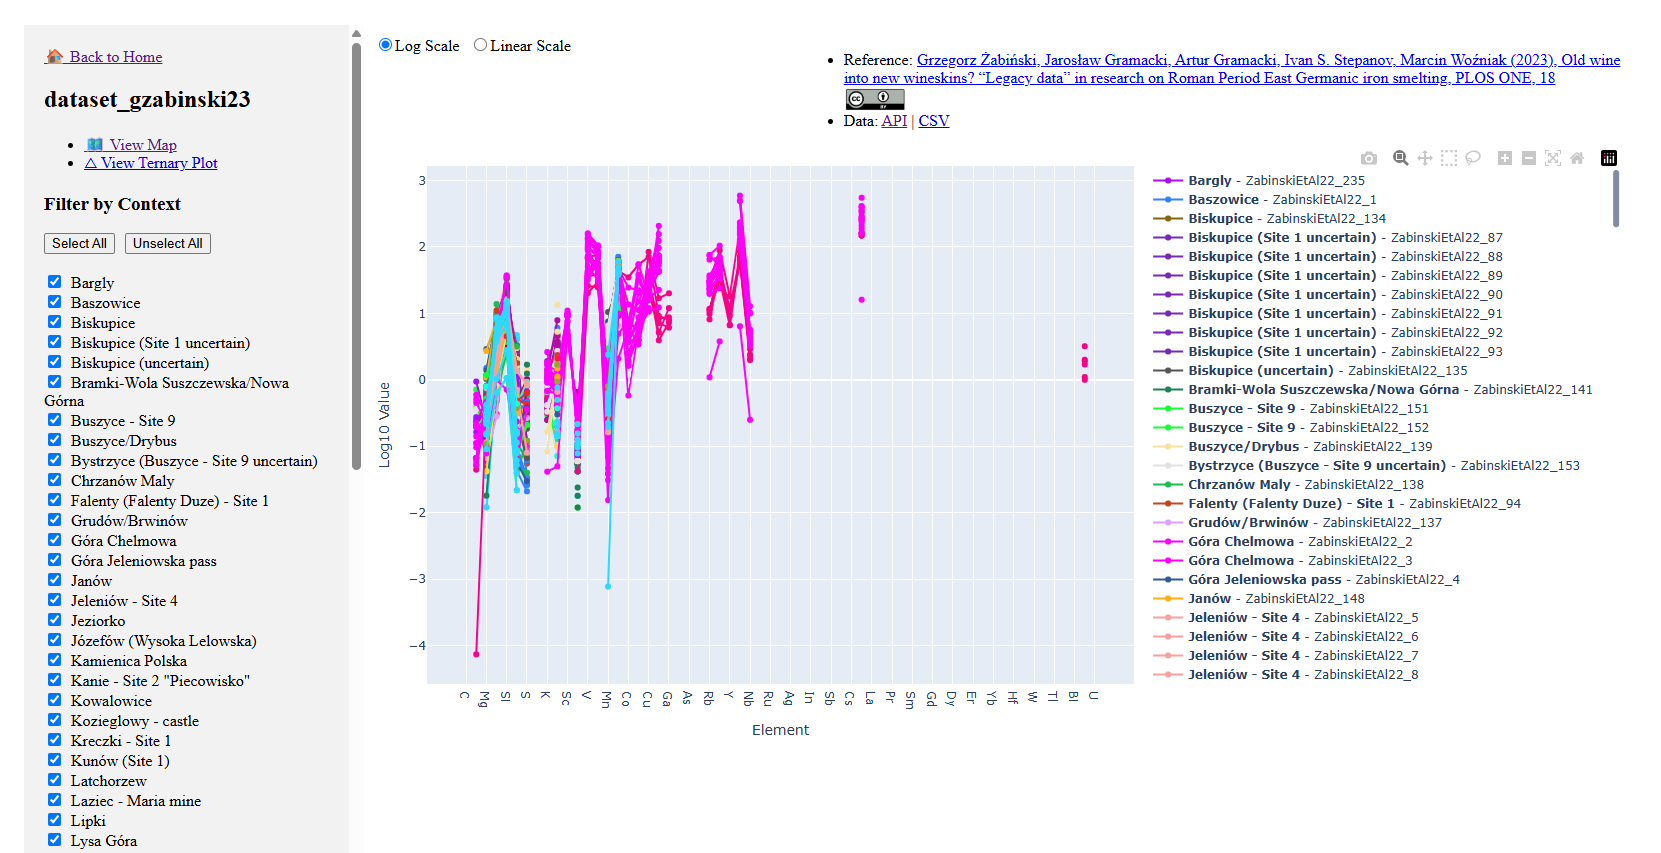
Line chart view of the `dataset_gzabinski23` dataset. By default, the chart uses a logarithmic scale.
Another possible view is the ternary plot: https://iramat-apps.cnrs.fr/dash/charttern/dataset_gzabinski23
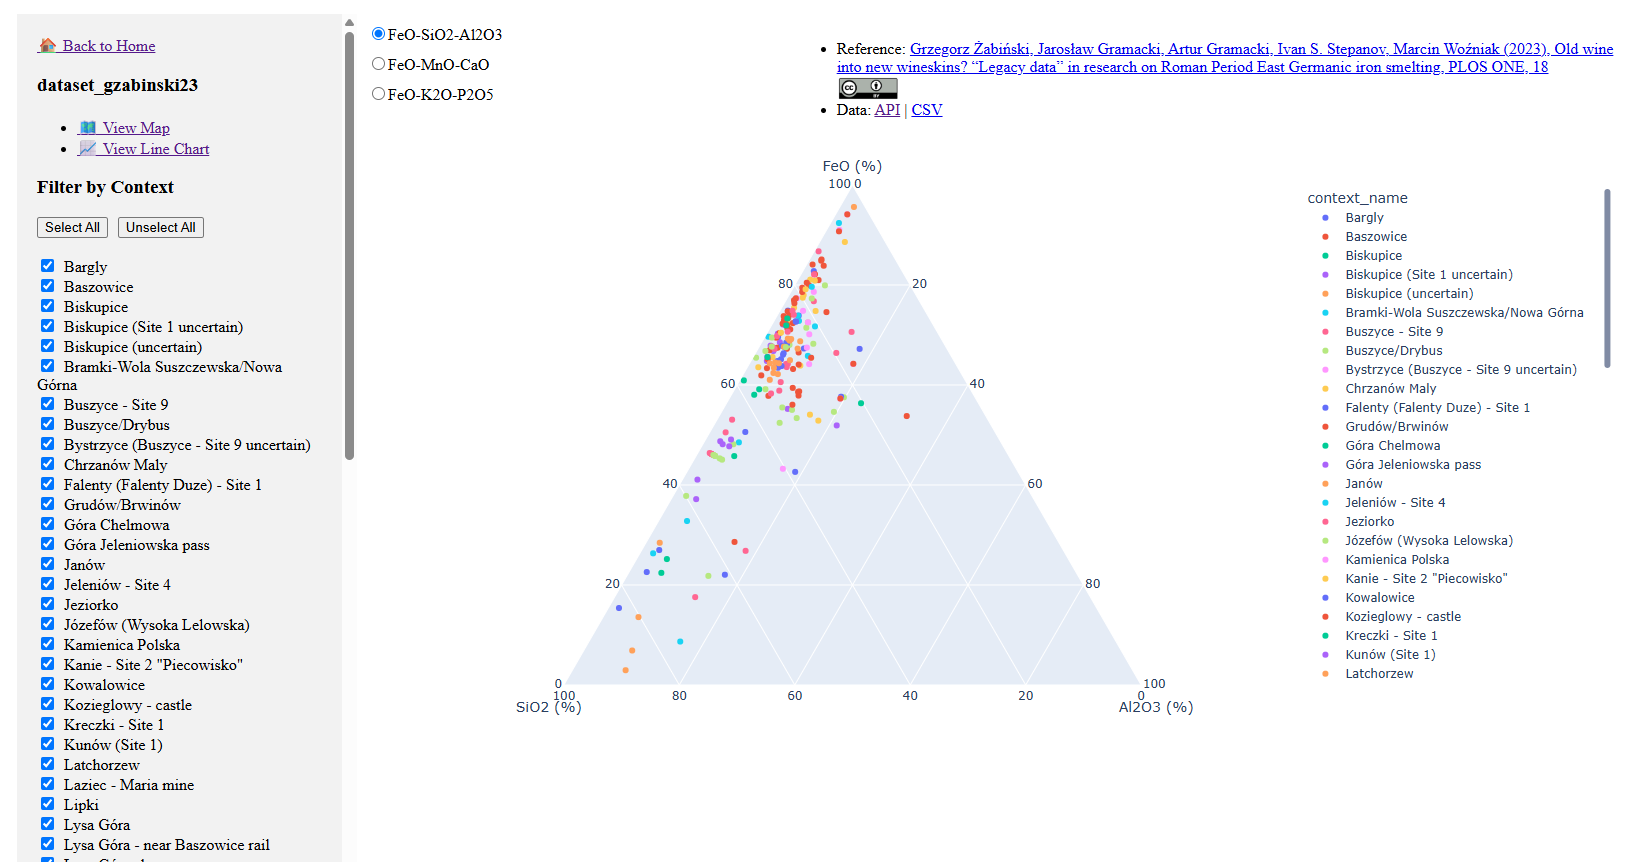
Ternary plot view of the `dataset_gzabinski23` dataset. By default, the three selected oxides are: FeO-SiO2-Al2O3.
Whenever data are made available, the corresponding references are provided to ensure proper citation. As mentioned above, each published dataset includes options for both CSV export and access through an API endpoint.
If you encounter an issue, please do not hesitate to open an issue on the CHIPS GitHub repository. Likewise, if you have suggestions for further developments and wish to contribute to the CHIPS interface, we welcome your feedback.
The source code of the dashboard is available on GitHub.
R package
Alongside the Python-based dashboard, the CHIPS database is accompanied by the R iRamat package, which facilitates the integration of CHIPS data into an R environment.
The dashboard is developed with the Python package dash and relies entirely on the CHIPS API endpoints exposed by the PostgREST web server, dynamically retrieving data in real time to generate maps, visualizations, and data exports. ↩︎