Title here
Summary here
Postgres..
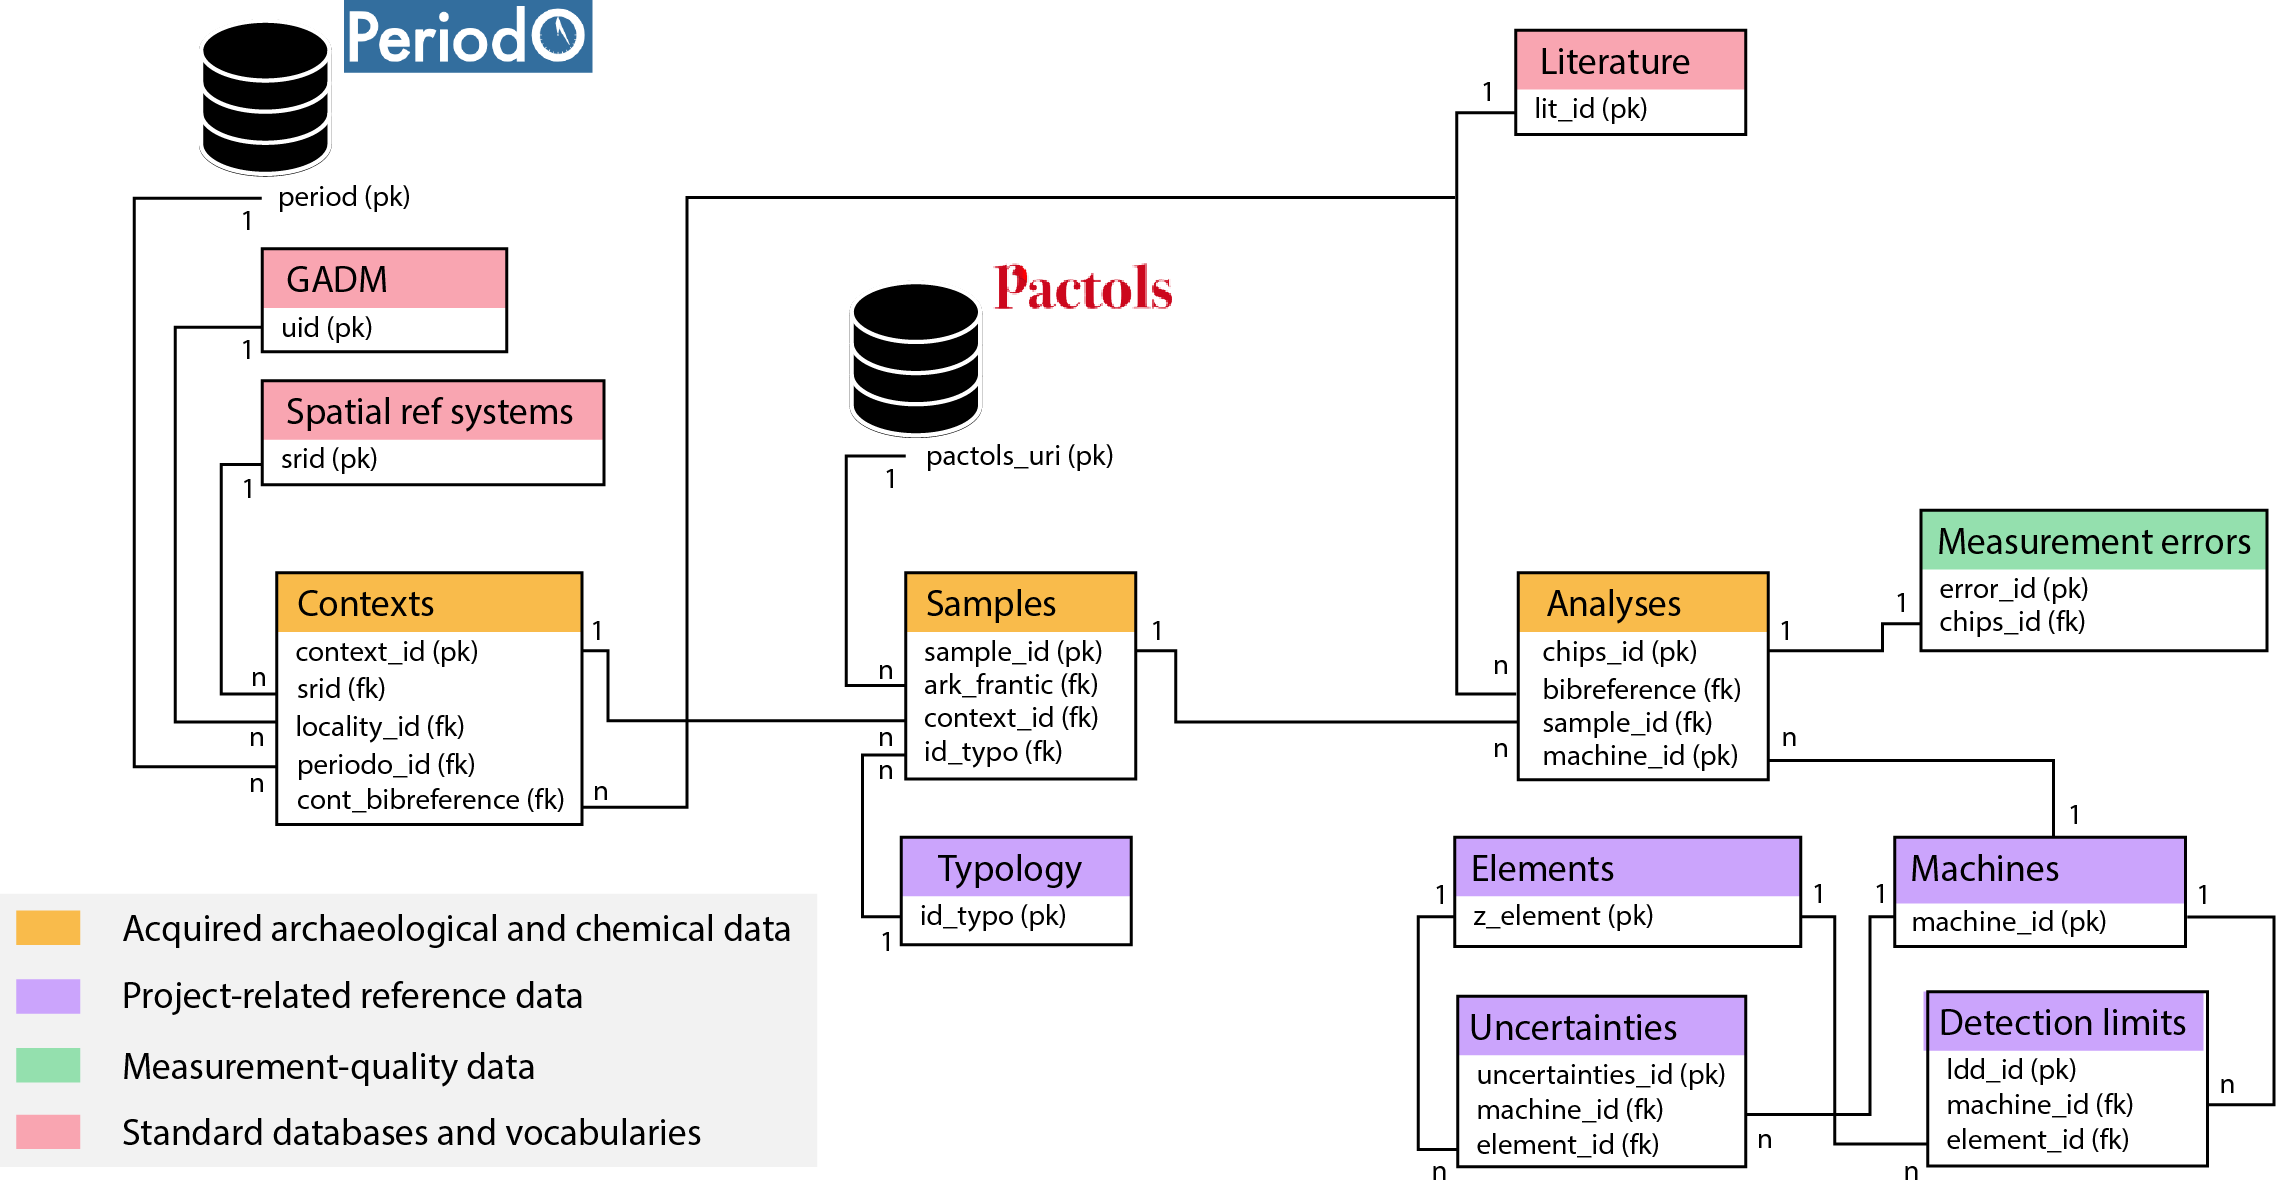
Simplified Entity-Relations Diagram (ERD) of the CHIPS DB
Columns are described in the GitHub repository:
Recording Measurement Errors
The following protocol has been established for recording measurement errors:
machines table, specifying the type of chemical analysis, the laboratory and the model of device used.machines table, for each chemical element listed in the elements table, and for a given range of values, the relative measurement uncertainty is expressed in the uncertainties table. The query result in Figure 2 shows how these values are organised. Uncertainties 151 to 154 represent the relative errors of the Centre de Recherches Pétrographiques et Géochimiques (CRPG) laboratory’s ICP-MS analyser for the element Yttrium. For a content of more than 50 mg.kg-1, this error is 5%. It increases to 15% for a measured content of between 1 and 50 mg.kg-1, and up to 100% for measured contents of less than 0.1 mg.kg-1.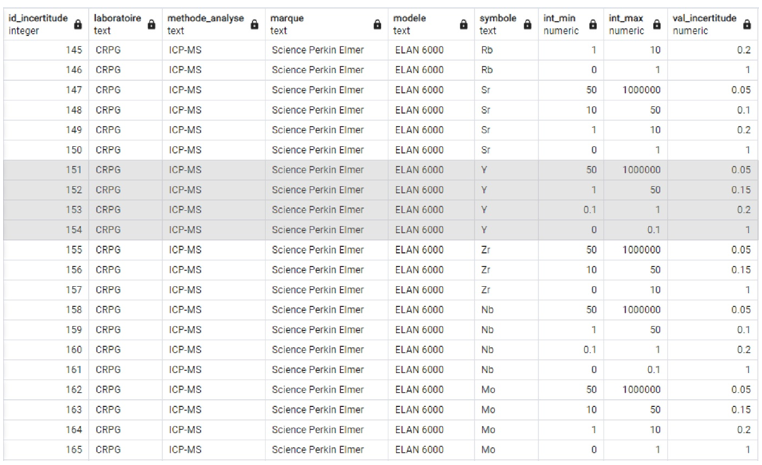
View built on the machines, elements and uncertainties tables, showing the relative measurement uncertainties depending on the analytical setup and the measured amount range
See the documentation hosted on the iramat-dev GitHub repo